The big picture
Our headline in 2025 was how much time it was taking to create an email, as it drifted up into 8 days territory. That has been reversed in 2026. Six findings carry the report.
Down from 8.21 days in 2025 — a 28% reduction that returns the industry to roughly its 2020 baseline. The first fall in eight years.
Chapter 01
The two groups don't differ in how fast they ship (they have the same median). They differ in what they're shipping and the environment they're shipping it in.
Full-time has dropped back to 2024 numbers.
For those taking more than 10 days to make an email, full-timers are the ones running complex enterprise sends with multiple stakeholders.
Essentially the same in both groups. Full-timers say AI gives them "more time for creative work" nearly twice as often as part-timers do.
Nearly 50% of part-timers work for a company with fewer than 50 people. Full-time workers outnumber part-timers 4:1 once list size passes 1 million subscribers.
Full-time email people are concentrated in the technical and optimization side of the craft, while part-timers are doing email as part of a broader creative role. Strategists and developers are likely to be twice as likely to be full-time, while part-timers are more than twice as likely to be designers and writers.
Pains differ with dedication too. Full-timers care more about process problems (like one-off requests, unclear brand guidelines) while part-timers care slightly more about tooling problems (like template set-ups, ESP flexibility).
Hypothesis: Full-timers are at lrger companies that can buy their way around ESP limitations.
| Group | Mean score | Promoters (9-10) | Passives (7-8) | Detractors (0-6) | NPS |
|---|---|---|---|---|---|
| Full-time | 6.52 | 24.3% | 33.4% | 42.3% | −18.0 |
| Part-time | 5.81 | 15.6% | 29.5% | 54.9% | −39.3 |
Chapter 02
Everyone believes the grass is greener on the other side. Does working for a bigger team (and therefore, a bigger company) positively impact how you make emails? The data is surprising: those in larger teams (aka “Enterprise Teams”) shows a slower, more taxed, less AI-confident version compared to those in smaller team sizes. And bigger teams seem to be reversing course in size too, maybe for that same reason.
Small and Medium together make up nearly three-quarters of respondents, so the survey skews toward smaller organizations. Weight the Large-company findings accordingly.
| Segment | Count | % of total (855) | % of valid (839) |
|---|---|---|---|
| Small (1-50 employees) | 289 | 33.8% | 34.4% |
| Medium (51-500 employees) | 329 | 38.5% | 39.2% |
| Large (500+ employees) | 221 | 25.8% | 26.3% |
| No Answer | 16 | 1.9% | — |
Share of respondents by team size, 2025 against 2026.
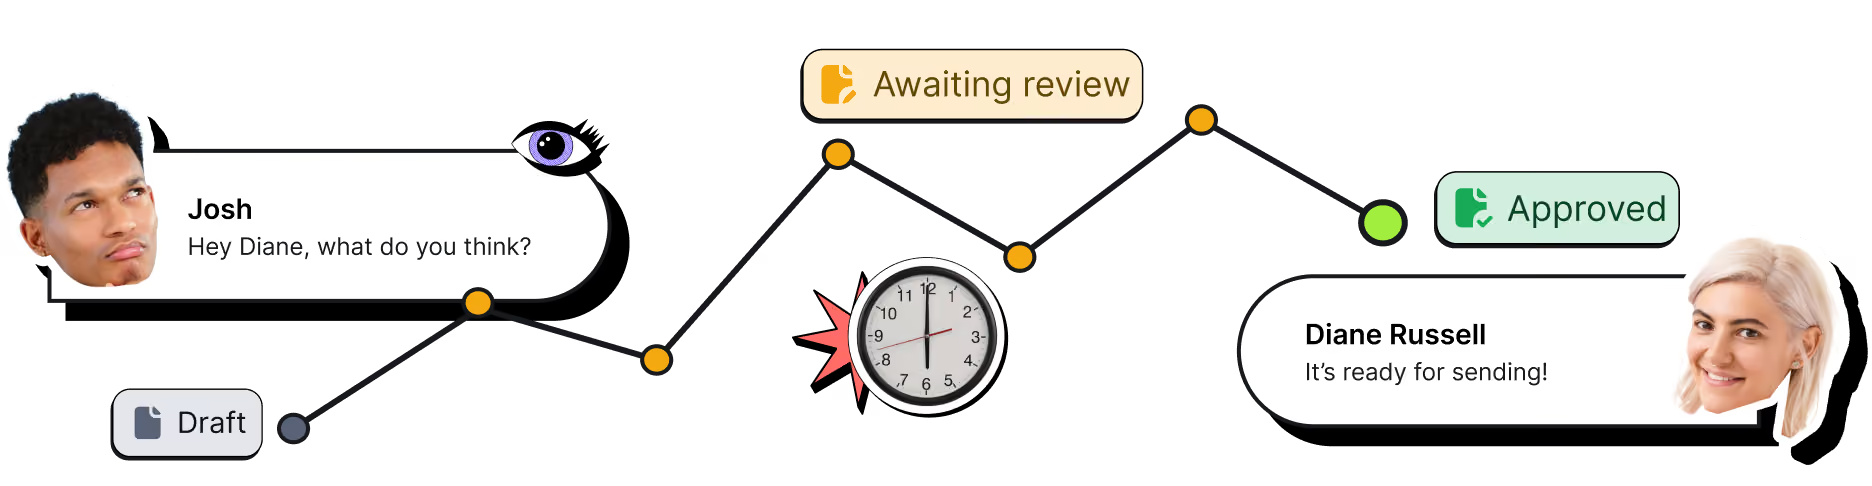
The killer pain point for Enterprise email makers is coordination, not creation.
Their biggest brand struggle is that multiple people are building and not keeping things standardized — nearly double the rate of non-enterprise people. They are also 20% more likely to mention the poor handoff between Design and ESP being a PITA (the official acronym for pain in the a**). Tight timelines is the only pain where they under-index (and only slightly: 43.4% compared to the average’s 45.6%). In other words, they have time, they don't have alignment.
Tool categories enterprise respondents want, against everyone else.
| Tool category | Enterprise wishlist % | Everyone else % | Diff |
|---|---|---|---|
| Predictive analytics (OfferFit, Monetate, Optimove) | 17.0% | 8.8% | +8.2 pp |
| Deliverability (ZeroBounce, Validity) | 14.1% | 12.8% | +1.1 |
| Inbox rendering (Litmus, EOA, Inbox Monster) | 12.0% | 13.4% | −1.4 |
| Competitor tracking (MailCharts, Sendview) | 11.3% | 8.6% | +2.7 |
| Code editors (Parcel, CodePen) | 10.0% | 7.7% | +2.3 |
| Design (Figma, Canva) | 7.1% | 17% | -9.9 pp |
| Small (1-50) | Medium (51-500) | Large (500+) | |
|---|---|---|---|
| Dominant role | Mixed Bag (51%), then Designer, Strategist | Mixed Bag (49%), then Strategist, Designer | Mixed Bag (40%), then Strategist, Developer |
| Full-time vs part-time | 66% part-time | Even split | 54% full-time |
| Team size | 46% solo, 42% on 2-3 people | Mostly 2-3 (47%), only 26% solo | Only 14% solo — 21% on teams of 10+ |
| Mean tenure | 6.3 yrs | 6.7 yrs | 7.6 yrs |
| Typical list size | 53% under 50k | Spread evenly 0-250k | 29% at 2M+ subscribers |
Chapter 03
Mixed Bag remains dominant and is still growing. Writers keep shrinking. Everything else is close to flat.
Share of all respondents. Bars scaled to 50%.
| Role | 2025 % | 2026 % | Δ pp | Relative % |
|---|---|---|---|---|
| Mixed Bag | 45.0% | 48.13% | +3.13 | +7.0% |
| Strategist | 15.0% | 15.20% | +0.20 | +1.3% |
| Designer | 12.0% | 12.18% | +0.18 | +1.5% |
| Writer | 10.0% | 7.60% | −2.40 | −24.0% |
| Executive | 8.0% | 7.12% | −0.88 | −11.0% |
| Developer | 5.0% | 4.83% | −0.17 | −3.5% |
| Project Manager | 4.0% | 3.98% | −0.02 | −0.5% |
| Analyst | 1.0% | 0.97% | −0.03 | −3.5% |
Eight roles, same hierarchy each time: share movement, the reality, then the attributes that separate them.
While this still represents the biggest slice of the pie, the multi-role generalist is growing yet again. As email infrastructure scales and becomes more personalized, companies are moving toward the "GenMarketer" model. Their daily reality has shifted from creative work to administrative overhead as they try to juggle everything. They show a highly significant correlation with the bottleneck phrase "Chasing down stakeholders for feedback, reviews, and approvals." They have essentially become campaign traffic cops in 2026.
Strategists consolidate as the dominant specialized role and have fully embraced the AI era — 70% use AI in their workflow, the highest of any role, and 26% want predictive tools, also the highest in the survey. But ascendance comes with anxiety: 14.5% say their role feels more uncertain, tied with Writers for the highest existential signal. They've integrated AI across the broadest task profile (86% copy, 57% campaign ideation, 33% trends, 24% journey analysis) and report "more strategic work" at 14.5%, second only to Executives.
Design's "Comeback (for now)" from 2025 has plateaued — the rebound stopped, but the role didn't slide. Designers remain the most distinctive role in the survey, with the lowest AI adoption (44.8%) and the worst ESP NPS (−46) of any major persona. 56% cite tight timelines as their biggest brand struggle, tied with Writers for highest, and 25% cite limited ESP design flexibility, highest in the survey. When they do use AI, they use it differently: 36% for HTML/CSS and 24% for design itself. 37.5% say "nothing has changed yet" with AI, the highest among major roles. 2027 will be the real tell.
Fourth year of decline. The AI Copy Crunch thesis holds, and the data goes harder than last year: from the 2020 peak of 16% to today's 7.6%, Writer share has dropped more than half over three years. 46% of Writers report "produce more/faster" pressure (the highest of any role by twelve points.) 20.6% say their role feels more uncertain, also the highest. They have the lowest ESP supplementation rate (46%), meaning they're not even buying tools to help themselves through the squeeze. The free-text answers tell the story bluntly: "I would have another person helping" and "one more person would be nice.”
The most optimistic AI narrative in the survey belongs to Executives. 21% say AI gives them "more strategic work" (the highest of any role) and only 7% feel their role is uncertain, the lowest of the major roles. They have the broadest AI usage profile of any persona (84% copy, 53% ideation, 32% trends, 26% design, 24% send-time). The modest year-over-year decline likely reflects role-title reshuffling rather than true erosion: some senior individual contributors who called themselves "Executive" in 2025 may now identify as Strategist.
The paradox role of the 2026 data. Developers have the lowest AI adoption (41%) of any major role, but also the highest mandate rate (41%)... meaning more than half of those being told to use AI haven't actually started. When they do use AI, they use it for things no other role emphasizes: 53% for HTML/CSS code and 33% for QA, by far the highest QA-via-AI rate in the survey. Zero percent want template builders; the only role where templates aren't on the wishlist. 75% supplement their ESP, the highest of any non-PM role. Only 15% cite "produce more/faster" pressure, the lowest in the survey: rendering, code quality and deliverability don't compress the way copy or design does.
The most over-tooled and most stretched role in the survey. 81% of PMs supplement their ESP (the highest of any role) and yet they have the slowest ship cycles (5-day median) and the highest "multiple people building emails" pain (45.5%, highest in survey). Their AI usage profile is unique: 100% of PM AI users do copywriting, 53% do campaign ideation, 41% do design. They cite "produce more/faster" pressure at 36% and "role feels uncertain" at 18%, even though they own the tooling budget. Their magic-wand answers are revealing: "closer access to actionable data that doesn't require manipulation," "having an experienced digital designer," and "more resources when I need them."
Smallest cohort in the survey, so the numbers here are directional only — but the signals are striking enough to note. Analysts post the highest "produce more/faster" pressure of any role (62.5%), the highest "always-on" pressure (25%), and report 25% role uncertainty. AI usage is heavily concentrated: 100% use it for copywriting and 60% for trends analysis. Their share has held flat for years, but their workload pressure profile suggests Analysts may be next in line for the squeeze Writers are currently absorbing.
Summary.Mixed Bag is the only role that is spread across company sizes, list sizes, team sizes and full-time/part-time. The small-company cluster tends to attract those in dedicated design and writing roles, while the large-company cluster tends to attract dedicated developers, project managers and strategists.
Company size is the single biggest predictor of how long an email takes.
Mean days per email, 2025 → 2026. Ordered fastest to slowest in 2026. Scale 0–14 days.
| Role | 2026 mean | 2025 mean | Δ | 2025 rank → 2026 rank |
|---|---|---|---|---|
| Mixed Bag | 4.67 | 6 | −1.3 | #1 → #1 (stays fastest) |
| Developer | 4.82 | 8 | −3.2 | #2 → #2 (holds) |
| Writer | 5.90 | 10 | −4.1 | #4 → #3 (moved up) |
| Strategist | 6.34 | 11 | −4.7 | #5/6 → #4 (moved up) |
| Designer | 7.26 | 8 | −0.7 | #2/3 → #5 (moved down in ranking) |
| Project Manager | 9.12 | 11 | −1.9 | #5/6 → #6 (holds) |
| Analyst | 9.25 | 14 | −4.8 | #8 → #7 (small n, directional) |
| Executive | 10.07 | 12 | −1.9 | #7 → #8 (now the slowest) |
Role explains part of the story, but it's not the whole picture. The roles that sped up most (Writer, Strategist, Analyst) are exactly the ones doing the most text-heavy, AI-driven work, which tracks with what we already know about where AI helps. But underneath every role sits a structural constraint that doesn't care what your job title is: how big is the list you're sending to. That variable turns out to move cycle time more than almost anything else in the dataset.
Scale 0–11 days. Average days per email by subscriber count.
While you'd expect more experienced people to complete an email more quickly, other variables like company size or team size throw a wrench in their abilities.
The time is practically identical. What matters is the size and complexity of the organization you're producing email inside.
The median was 5 across the board, but there's no impact on production time if you use more or less.
Those who indicated having enough resources did not have faster email production times compared to those who felt under-resourced.
Chapter 05
AI correlates with roughly 25% faster email cycles. Let’s remember that correlation does not me causation, though. The people adopting AI also tend to work in more nimble conditions. Regardless, there is evidence that AI does play a factor when you slice the data for specific use cases.
Scale 0–10 days.
What this means. AI-driven QA specifically is the single sharpest accelerator in the dataset at 4.39 days. Every role got meaningfully faster year over year, but Designers gained the least — they remain the role least transformed by AI productivity.
Chapter 06
For those who have complex approval tools (usually tied to larger companies and bigger email teams), production is nearly 3× slower than for people working in a simplified process like Slack.
Scale 0–10 days. Median shown alongside.
Chapter 07
The overall ESP satisfaction level sits at -29.8 (or a mean raw score of 6.11/10). Compared to prior years, this number hasn’t moved at all. For context, NPS scores are considered good if they are positive, excellent if they exceed +50. At -29.8, this more than a few bad actors bringing the average down. Email makers are dissatisfied regardless of who they use, controlling for company size, resources, team roles, and tenure.
Net Promoter Score by access to supplemental email tools. Scale −80 to 0.
A new slice this year: segments of email makers whose negative response comes from factors beyond the platform itself.
Strongest detractor signal in the dataset; likely not decision-makers, but a signal of widespread organisational chaos around tooling. These individuals are siloed and at bigger companies.
Dissatisfied, under-tooled, aware of the gap. Largely a lack of resources — budget, people — but also a lack of knowing what's available or possible.
"Never" users (−23.5) are more satisfied than "No" users (−39.4). Ideological refusers are content; the "No" group is where possible frustration lives.
Focusing on accessibility is a proxy for process maturity. It is more common at large companies, which have longer cycles but better overall NPS than those who aren't focused on accessibility.
The newest folks are notably the least happy, but from 3 years onward satisfaction basically plateaus. There's no steady "the longer you do this, the happier you get" story... at least with your ESP.
| Tenure | Mean score | NPS |
|---|---|---|
| 0-2 yrs | 5.48 | −50.0 |
| 3-5 yrs | 6.10 | −31.2 |
| 6-9 yrs | 6.12 | −32.2 |
| 10+ yrs | 6.29 | −22.4 |
Chapter 08
Team cost per email is computed using the BLS method for Marketing Managers: $75/hr fully loaded, $600 per person-day, one full business day. These figures are modelled from survey inputs, not answers respondents gave.
Based on a mean team size of 3.43 people at $600 per person-day.
Scale $0–$3,500.
| Segment | Mean team size | Est. cost/email |
|---|---|---|
| Overall | 3.43 people | $2,060 |
| Full-time | 3.80 | $2,280 |
| Part-time | 3.12 | $1,870 |
| Large (500+) | 5.39 | $3,233 |
| Medium (51-500) | 3.23 | $1,939 |
| Small (1-50) | 2.17 | $1,302 |
Supplemental-tool spend works out at roughly $247/month per team based on the tools reported in our survey, excluding the ESP subscription itself. Spread across the emails a team ships, the more you ship, the better ROI you get on those tools:
Chapter 09
Building more emails at once barely correlates with team size (r=0.188) or company size (r=0.055). We all feel the burden of an extra email added to the pile, not matter where you work. That’s because individual workload and context-switching are real weights, regardless of org structure.
Scale 0–19 days. Median days increase per email as more emails in flight increase
This raw data is compelling, but it could be a proxy for company size, team size, or something else that is driving the slowdown. So we ran a controlled regression, isolating each variable's effect while holding the others constant. What the data shows is that company size has the biggest impact on added time per email, as well as the number of emails or how the team is structured. But it is also offset by the team using AI.
Effect on days per email. Zero line at centre; scale ±1.6 days.
| Parallel emails | Mean days | Median days |
|---|---|---|
| 1 | 4.24 | 2.0 |
| 2–3 | 4.35 | 3.0 |
| 4–5 | 5.12 | 3.0 |
| 6–10 | 6.81 | 5.0 |
| 10+ | 18.05 | 10.0 |
Chapter 10
People who collaborate with legal are disproportionately at large companies (53% vs 22%), on bigger teams (4.98 vs 3.17 people), and juggling far more parallel emails (9.6 vs 5.8) — all three things we already know independently slow production down. Once you control for that, legal's own residual effect shrinks, but still accounts for an additional 1.87 days more per email when they are involved.
Collaborating with merchandising, manufacturing or production teams adds the most time out of any department in the data set. If you have one of these departments roped in, you are looking at an extra 3 days to cycle time. This is likely retail and e-commerce specific because syncing on product imagery, live inventory, pricing changes, and manufacturing timelines don't move on marketing's schedule.
Days added to cycle time after controlling for company size, team size and parallel workload. Scale 0–3.5 days.
Surprisingly, you can see that Executive Leadership involvement can actually reduce the number of days. This is likely due to a clear approver/driver in that department rather than a chorus of people pointing fingers and delaying time. In other words, if someone knows that the CEO is involved, they aren't going to stall on it.
Key takeaways
Average production time fell from 8.21 to 5.90 days — the first drop in eight years, and back to roughly the 2020 baseline.
Company size is the single biggest predictor of how long an email takes: 3.6 days at small companies, 8.5 at large ones.
AI users ship ~25% faster (5.03 vs 7.06 days), and AI-driven QA is the sharpest accelerator at 4.39 days.
The bottleneck is the approval ritual, not content creation: dedicated approval tools sit at 9.59 days against 2.48 for Slack or Teams.
Teams got smaller: 71.5% now work in groups of three or fewer, reversing an eight-year decline in a single year.
Tenure and full-time status don't matter for speed. What matters is the size and complexity of the organization you produce email inside.
We have more survey results coming out soon. Get on the list and we'll send you more as they come out.
Get early access